
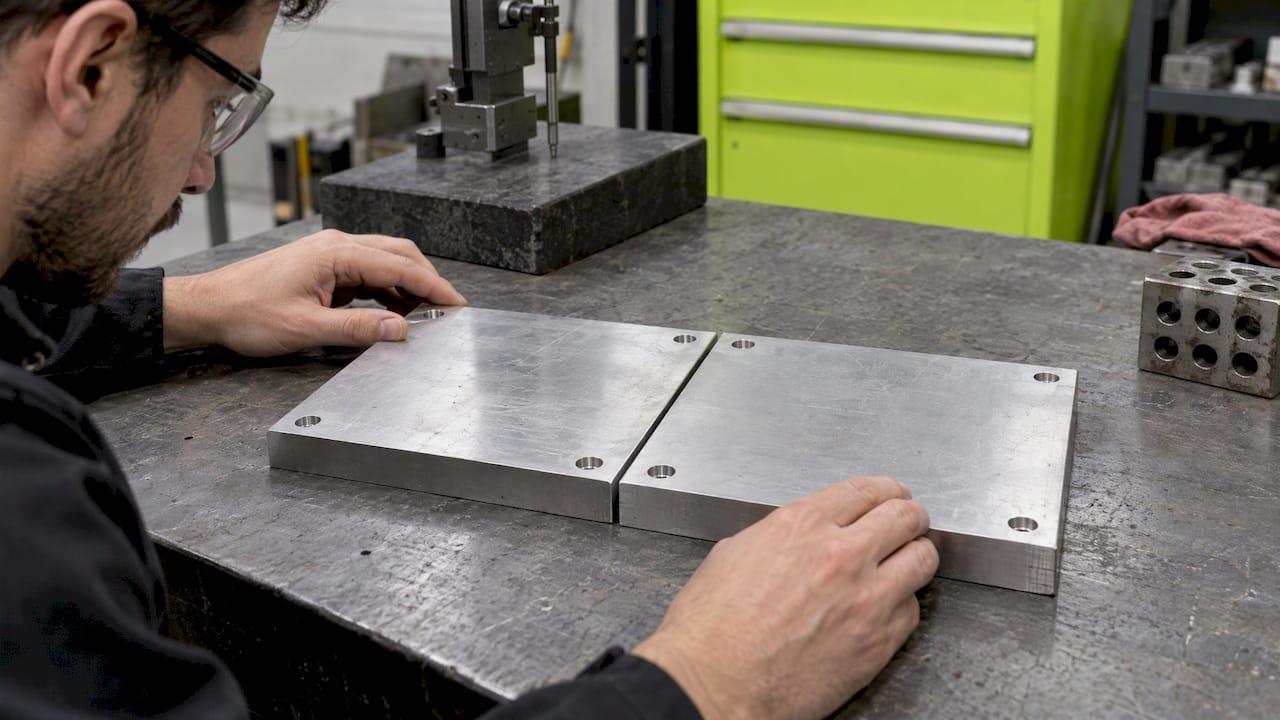
A tolerance stack-up is the cumulative effect of every part tolerance in a chain of dimensions, and it tells you whether an assembly will still fit and work when each part sits anywhere inside its limits. You calculate it by choosing the gap or fit that matters, tracing every dimension that controls it, and adding the tolerances either arithmetically (worst case) or statistically (RSS). The worked example below shows both on the same assembly, with numbers you can check by hand.
TL;DR
- A stack-up answers one question: with every part at its tolerance limits, does the critical gap or fit still work?
- Worst case adds tolerances directly and guarantees fit if every part is in spec. RSS adds them as squares and predicts the likely spread, so it allows looser tolerances.
- Start with the critical dimension, then write down the loop of dimensions that controls it, with a sign (+ or −) on each.
- Most bad stack-ups fail on setup: a missed dimension, a wrong direction, or a statistical method used on a process that is not centered.
- If the math says a tolerance has to be tight, talk to your machinist early. Cost and capability belong in the calculation.
What a tolerance stack-up actually is
No machined part is exactly its nominal size. The drawing gives each dimension a permitted band, such as 0.800 ±0.002 in. When parts bolt, press, or slide together, those bands combine. A gap that looks comfortable on the nominal model can close to zero, or open far too wide, when the parts land at opposite ends of their bands.
Tolerance stacking (also called a stack-up or stack) is the process of calculating that accumulated variation. Engineering references describe it as the problem-solving process in mechanical engineering of calculating the effects of accumulated variation on an assembly, and they split the methods into worst-case and statistical approaches.
The output is a range for one result: a clearance, an interference, a flush condition, a preload, an alignment. Everything else in the analysis exists to produce that range and decide if it is acceptable.

When you need a stack-up
You do not need a formal stack for every part. You need one when:
- Several parts together control a fit, such as a stack of spacers, bearings, and a retaining ring inside a housing.
- The nominal clearance is small compared with the sum of the tolerances.
- A failure would be expensive: a binding mechanism, a leak path, a loose joint, a part that cannot be assembled by hand.
- You are about to tighten a tolerance and want to know whether it actually buys you anything.
- You are moving from one-off prototypes to a production run, where parts will land across the whole tolerance band instead of near the middle.
Prototypes often hide stack problems. A single hand-fitted assembly can be made to work. Ten assemblies built from random parts show what the drawing really allows.
Step 1: Pick the critical dimension
The critical dimension is the single result you care about. Define it as a gap, distance, or fit between two named features, and say which direction is the failure.
Good examples:
- The gap between a bracket face and a bearing shoulder must stay between 0.005 in and 0.020 in.
- The pin must enter the hole without force: the smallest hole must exceed the largest pin.
- The cover must sit flush to within 0.010 in.
A vague goal ("make sure it fits") gives you nothing to calculate. Write the limits you can accept, because the result of the stack is compared against them at the end.
Step 2: Trace the loop of dimensions
With the critical dimension chosen, walk from one side of the gap to the other through the assembly, following each part's dimension that connects one contact surface to the next. This path is the tolerance loop or chain. Every dimension on the path belongs in the stack. Every dimension off the path does not.
Practical rules:
- Start at one face of the gap and end at the other, so the loop closes.
- Move only along real contact surfaces or datums. If two parts touch, the path crosses at that contact.
- Give each dimension a direction. Dimensions that move you toward the far side of the gap are positive. Dimensions that move you back are negative.
- Include hidden contributors: fit clearance in a pin or bolt, the float of a hole, and thickness added by coatings. A hard anodize layer adds thickness to a surface, so see our guide to hardcoat anodize thickness before you assume a dimension is unchanged after finishing.
- Convert any geometric tolerances (position, perpendicularity) into their effect along the loop direction. Our notes on true position basics and perpendicularity callouts cover how those zones behave.
Draw the loop as a simple sketch with arrows. Most errors show up the moment you draw it.
Step 3: Calculate with worst case
Worst-case (arithmetic) stacking places every dimension at its limit, in the direction that does the most damage. The result is the maximum and minimum value of the critical dimension. Designing to worst case guarantees assembly and function when every part is within its limits, but it often forces tight tolerances and higher cost.
The formula for an equal-bilateral stack is:
Tolerance of result = Σ |tolerance of each dimension|
Worked example in inches
A housing has a 2.000 ±0.004 in internal length. Three parts stack inside it end to end:
| Dimension | Nominal | Tolerance | Direction |
|---|---|---|---|
| Housing length | 2.000 in | ±0.004 in | + |
| Part A | 0.800 in | ±0.002 in | − |
| Part B | 0.600 in | ±0.002 in | − |
| Part C | 0.500 in | ±0.002 in | − |
The nominal gap is 2.000 − (0.800 + 0.600 + 0.500) = 0.100 in.
Worst-case tolerance on the gap: 0.004 + 0.002 + 0.002 + 0.002 = ±0.010 in.
So the gap ranges from 0.090 in to 0.110 in. If you can accept that range, the design works with every combination of in-spec parts. Note that the direction signs matter for the nominal, but tolerances always add, whichever way the dimension points.

Step 4: Calculate with RSS (statistical)
Root-sum-squares assumes the parts will not all sit at their extremes at once. Individual dimensions vary independently, so it is unlikely that every one lands at its worst limit in the same assembly. RSS predicts the likely spread instead of the extreme.
The formula is:
Tolerance of result = √(t₁² + t₂² + t₃² + …)
For the same assembly:
- Squares: 0.004² = 0.000016, and 0.002² = 0.000004 for each of the three parts, totaling 0.000012.
- Sum: 0.000016 + 0.000012 = 0.000028.
- Square root: √0.000028 ≈ 0.0053 in.
The RSS gap is 0.100 ± 0.0053 in, or about 0.0947 to 0.1053 in. That is roughly 47% less spread than the worst-case ±0.010 in on the identical drawing.
The percentage depends on the number of terms and how uneven they are. More contributors of similar size usually mean a bigger gap between the two methods.
What RSS promises, and what it needs
In the standard formulation, the assembly values fall within ±3σ, with about 0.27% outside, under the assumption of normally distributed, centered dimensions. Those assumptions are the whole deal. If a process runs off-center, or an operator sorts parts so only one side of the tolerance ships, the 0.27% figure no longer applies.
The same academic report describes more than the two basic methods. It covers arithmetic stacking, simple RSS, RSS with inflation factors for nonnormal distributions, and stacking with mean shifts. Its point is that each method rests on assumptions, so you should choose by what your process does, not by which formula is easiest.
Worst case or RSS: choosing a method
| Question | Worst case | RSS |
|---|---|---|
| What does it predict? | The absolute extremes | The likely spread |
| Guarantee of fit | Every in-spec part fits | A small share may not |
| Tolerances needed | Tighter | Looser |
| Best for | Safety-critical fits, very low volume, mixed or unknown sources | Higher volume, stable and centered processes |
| Main risk | Over-specified, costly parts | Out-of-spec assemblies if assumptions fail |
A useful habit: run both. If worst case passes, you are done. If only RSS passes, you have a decision to make about how many assemblies could fail and what a failure costs. If neither passes, the design or the tolerances have to change.
For small batches, such as prototypes and short runs, be careful with RSS. A statistical result describes a population. Ten parts is not a population, and one unlucky assembly is still a failed assembly.
Interpreting the result
Compare the calculated range against the limits you wrote in step 1.
- Range fully inside the limits: the stack passes.
- Range partly outside: with worst case, the design fails some in-spec combinations. With RSS, a share of assemblies will fail, and some simulation tools express that as a probability of fitting versus not fitting, for example 96% versus 4% in one vendor tutorial's illustration.
- Range far inside the limits: you may be over-tolerancing. Loosen the largest contributor and recheck.
The largest contributor is the lever. In the example, the housing's ±0.004 in is twice any other term. Under RSS it accounts for more than half of the variance (0.000016 of 0.000028). Opening a tolerance on a small contributor barely moves the answer, while tightening or relaxing the biggest one changes it most.
Common mistakes that make a stack-up misleading
- Wrong critical dimension. Calculating a gap that is not the one that fails.
- Missing a link. A forgotten washer, shim, coating, or datum shift makes the result look better than reality.
- Wrong signs. Mixing up which dimensions add and which subtract changes the nominal gap, so the whole range sits in the wrong place.
- Unequal tolerances treated as equal. Convert unilateral and limit dimensions to a nominal with a bilateral band first.
- Ignoring geometric tolerances. Position, perpendicularity, and flatness add variation in the loop direction. Material condition modifiers can also add bonus tolerance; see our explanation of MMC and LMC bonus tolerance.
- Using RSS on an uncentered process. If the mean of a dimension is shifted, the statistical result is optimistic.
- Ignoring fits. Pin and hole clearance is a stack contributor. Our references on dowel pin hole tolerances and slip fit tolerances give typical bands to use.
- Assuming the drawing equals the part. Measurement uncertainty and shop capability decide what you actually receive. See machined part inspection and gage R&R for how measurement error enters.
- Forgetting temperature and materials. Aluminum and steel move differently with heat, which matters for long stacks of mixed-material parts. Temper also affects what is practical to hold; see T6 versus T6511 aluminum.
Turning the math into a drawing
A stack is only useful if the result lands on the drawing and the supplier can read it. Put the critical tolerances on the dimensions that dominate the stack, leave general tolerances on the ones that do not, and note which features are datums. If the stack forces something tight, our guide to tight tolerance machining explains what that does to process, inspection, and cost.
Keep the calculation with the drawing package. When a quality team audits suppliers, the stack, the revision, and the vendor's documentation need to agree; teams building that discipline sometimes look at how ISO 9001 vendor documentation audits are cross-referenced.
Our perspective
We machine parts for a living, so we see stack-ups from the other side of the drawing. The most useful ones come from engineers who talked to the machinist before the tolerances were final.
When one shop designs, machines, and ships a part, the loop is short. We build products such as our E2 Kickstand for electric mini bikes, and we know that a bolt-on part has to fit the bike it was made for, within the dimensions the bike actually has. That is a stack-up problem in everyday clothes.
Our advice: run worst case first, then RSS, then call the shop. Tell us which gap matters and which features are datums, and we can say which tolerances are easy and which will add cost. A small change to the biggest contributor usually beats tightening everything.
Drake
Get the stack machined the way you calculated it
If your analysis lands on a few tight dimensions, we can help. Flying Chip Factory offers prototype machining, short-run production, and fixtures, brackets, and support parts, with direct access to the machinist who will cut your parts. Send your drawing and the critical dimension, and we can talk through what is practical before you commit to a run. See our machining services.

If you ride an electric mini bike, our E2 Kickstand for the KTM SX-E 2, GASGAS MC-E 2, and Husqvarna EE 2 is a CNC-machined, bolt-on part, priced at $100-105.
FAQ
What is meant by tolerance stack-up?
It is the combined effect of the tolerances of all parts in a dimensional chain on one critical result, such as a gap or fit. It tells you the smallest and largest value that result can take when parts are anywhere within their limits.
How do you calculate a tolerance stack-up?
Define the critical dimension, trace the loop of dimensions with a sign on each, and compute the nominal result. For worst case, add all tolerances. For RSS, square each tolerance, add the squares, and take the square root. Compare the range with your acceptable limits.
What is an RSS tolerance stack-up?
RSS (root sum square) is a statistical method that predicts the likely spread of the result instead of the extremes. It assumes independent, roughly normal, centered dimensions. Under those assumptions about 0.27% of assemblies fall outside the stated range.
Should I use worst case or RSS?
Use worst case when every assembly must fit, such as for safety-critical or very low-volume work. Consider RSS for higher volumes from stable, centered processes where a small, known failure share is acceptable. Running both shows how much margin a design has.
Sources
- Tolerance analysis
- Tolerance Stack Analysis Methods (RSS limits)
- Tolerance Stack Analysis Methods (methods overview, 1995)
- CETOL tutorial (fit probability illustration)