
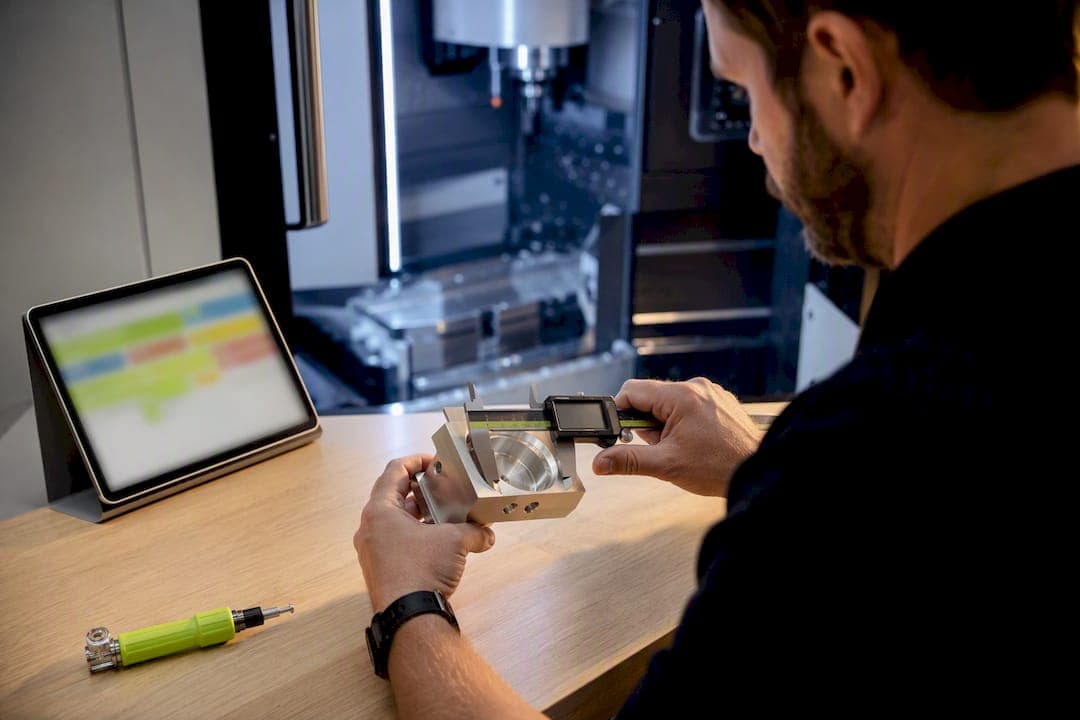
In machining, SPC is a data-driven method that uses control charts to detect and stop variation before parts go out of spec. Instead of catching bad parts after they're cut, it tracks the process itself, so an insert wearing down or a fixture shifting shows up as a trend on a chart long before a part fails inspection. The payoff is fewer scrapped runs and a process you can actually predict shift to shift. The section below on implementation walks through exactly how to set one up on a real feature.
TL;DR:
- Using the correct control chart type ensures meaningful detection of process drift in machining, particularly for small, gradual changes like tool wear.
- Proper subgrouping, sample size, and measurement validation are crucial to establish trustworthy control limits and avoid false signals.
- Control rules like points beyond three sigma or runs of consecutive points on one side help identify both sudden failures and slow process drifts effectively.
- Standards such as AIAG-VDA and ISO 9001 emphasize documentation, process understanding, and monitoring records over simply plotting data.
- Automating data collection with Industry 4.0 systems enhances real-time monitoring, but solid fundamental practices in point selection, sampling, and gage R&R remain essential.
What SPC in machining actually means
Statistical process control isn't the same thing as inspection, and mixing the two up is the single most common reason SPC programs stall. Acceptance sampling checks parts after they're made and sorts good from bad. SPC watches the process while it's running and flags it before bad parts happen. The Association for Quality (ASQ) frames this as a three-phase discipline: understand the process and its specifications, eliminate assignable causes of variation, then monitor ongoing production to keep it that way.
That distinction matters most in machining because tool wear and thermal drift are gradual, not sudden. A boring bar wearing 0.0002 inches per part doesn't fail an inspection on part one. It fails on part 400, after the bore has crept past tolerance for the last fifty pieces. SPC catches the drift at part 200 because the chart shows a trend, not just a pass/fail snapshot.
A few machining-specific patterns show up constantly:
- Bore diameter drifting outward as an insert dulls, visible as a slow upward trend on an X̄ chart long before any single part is rejected.
- Spindle thermal growth shifting hole locations during the first hour of a shift, then stabilizing.
- Fixture wear introducing a slow, repeatable bias in a critical dimension across hundreds of cycles.
What's changed in the last decade is how easy this data is to collect. In-process probes, coordinate measuring machines (CMMs), and manufacturing execution systems (MES) can log measurements automatically instead of relying on an operator writing numbers on a paper tally sheet. That shift is what makes real SPC practical on short runs and prototypes, not just million-part automotive lines.
Which control chart fits your machining data
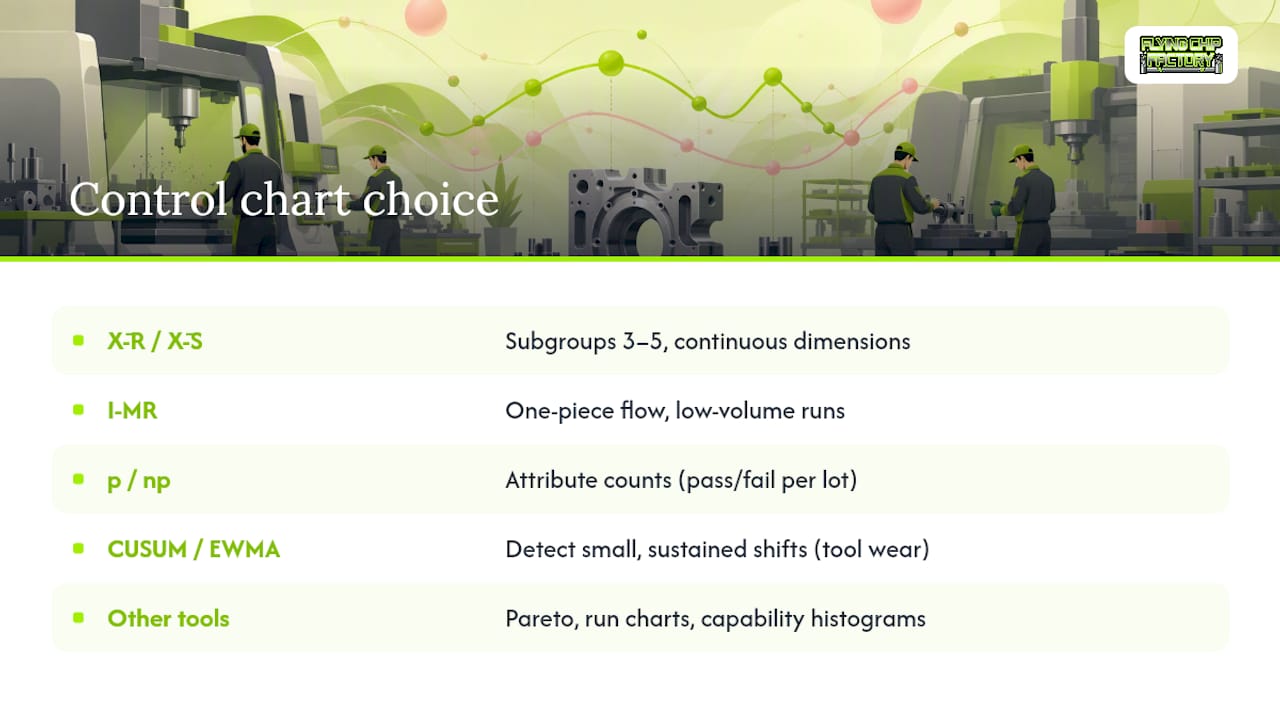
Picking the wrong chart type is almost as bad as skipping SPC entirely, because it produces control limits that don't reflect how the process actually behaves. The choice comes down to what you're measuring and how the parts come off the machine.
X̄-R and X̄-S charts work when you're pulling subgroups of consecutive parts, typically 3 to 5, and tracking a dimensional feature like a bore diameter or a shoulder length. The X̄ chart tracks the subgroup average; the R or S chart tracks the spread within each subgroup. Subgrouping only works when the parts in each subgroup came from the same short window of time and the same source of variation, otherwise you're averaging away the very signal you're trying to catch.
I-MR charts (individuals and moving range) are the right call for low-volume runs, one-piece flow, or any situation where subgrouping doesn't make sense, such as a prototype job where you're machining one part every twenty minutes. Automated in-process probes often feed I-MR charts directly since every part gets measured.
p and np charts track attribute data, pass/fail counts like the number of parts with a burr or a missed feature per lot, rather than a continuous measurement.
CUSUM and EWMA charts catch small, sustained shifts that a standard X̄ chart can miss, which makes them useful for slow tool wear trends where the shift per part is tiny but cumulative.
Beyond the core charts, Pareto charts for defect categories, run charts for quick visual trends, and capability histograms round out a shop's toolbox. The AIAG‑VDA SPC guidance stresses that these tools exist to build process knowledge and reduce variation, rather than to serve as a substitute for tolerance checking.
Pro Tip: If you're only going to chart one thing on a new job, chart the feature with the tightest tolerance relative to your process capability, not the feature that's easiest to measure.
How to implement SPC on a machining cell, step by step
Starting SPC on a real part doesn't require a statistics degree, but it does require doing the steps in the right order. Skip a step and you end up with charts that look official but don't actually control anything.
- Select Key Process Characteristics (KPCs). Pick the two or three dimensions on the print that actually drive function or assembly fit, not every dimension that happens to have a tolerance. A KPC on a kickstand pivot bore matters more than a cosmetic chamfer.
- Run and validate First Article Inspection (FAI). Before you chart a single point, confirm the process is capable of hitting the print at all. Charting an unvalidated setup just documents chaos with more precision. Our first article inspection guide walks through what a defensible FAI actually looks like.
- Define the sampling plan and measurement method. Decide subgroup size, frequency, and which gage will do the measuring, then run a gage repeatability and reproducibility (gage R&R) study so you know the measurement noise isn't swamping the process signal.
- Write the SOP. Document exactly how an operator pulls a sample, records it, and what to do if a point falls outside the limits. Vague instructions are where SPC programs quietly die.
- Establish control limits and response actions. Calculate limits from stable baseline data, not from the tolerance band, and write down what happens when a point breaks a rule: stop, inspect, adjust, or escalate.
- Assign roles. Operators check and plot points each cycle, technicians escalate out-of-control signals, and engineers review trends on a set cadence, weekly at minimum on active jobs.
Pro Tip: Annotate every chart with tooling changes, insert swaps, and program edits right on the chart itself. Six months later, that annotation is the difference between a five-minute root-cause investigation and a two-day one.
Getting sample size and subgrouping right
A chart is only as trustworthy as the sampling behind it, and this is where a lot of shop-floor SPC quietly goes wrong. Subgroups need to represent a single, consistent source of variation, which usually means pulling consecutive pieces rather than grabbing one part per hour and calling it a subgroup.
Three subgrouping approaches cover most machining situations:
- Consecutive-piece sampling pulls parts back to back, ideal for catching within-cycle variation on high-volume runs.
- Cycle-based sampling pulls one part per machine cycle across a shift, useful when cycle time is long and volume is low.
- Time-based sampling pulls parts at fixed intervals, better suited to catching drift over hours rather than variation between individual parts.
For control charts, most shops need at least 20 to 25 subgroups before control limits mean much statistically. Fewer than that, and the limits are just noise dressed up as math. Capability studies generally want a longer baseline than a control chart does, since you're trying to characterize the full spread of normal variation, not just confirm stability. Before any of this matters, confirm your gage R&R is solid and your instruments are on a real calibration schedule. Sloppy measurement uncertainty poisons every chart downstream, a point covered well in PCS Precision's guide to calibration in industrial accuracy.
Cp and Cpk: what capability actually tells you
Capability only means something once the process is already in statistical control. Calculating Cpk on an unstable process gives you a number, just not a trustworthy one.
The NIST process capability guidance defines Cp as the ratio of tolerance width to process spread: (USL−LSL) / 6σ. It tells you whether the process could fit the tolerance if it were perfectly centered. Cpk accounts for centering and takes the smaller of two one-sided calculations: min[(USL−μ)/3σ, (μ−LSL)/3σ]. A process can have a great Cp and a poor Cpk if it's capable but running off-center.
What the numbers mean: A Cpk of 1.33 is a common minimum target in many machining shops and corresponds to roughly 63 parts per million defective for a centered, normal process. A Cpk of 1.0 pushes that closer to 2,700 ppm, a meaningfully higher reject rate on any volume run.
Real machining data isn't always normally distributed, especially with one-sided features like roundness or flatness. In those cases, a Box-Cox transformation or a nonparametric capability index gives a more honest picture than forcing a standard Cpk formula onto skewed data. Ignoring that distinction is how shops end up trusting a capability number that doesn't reflect reality.
Where SPC programs go wrong
Most failed SPC efforts aren't a statistics problem, they're a discipline problem. A few mistakes show up again and again:
- Charting during setup instability. Sampling before a new job is dialed in bakes noise into your baseline. Keep setup verification separate from production sampling.
- Measuring the wrong features. Tracking a cosmetic dimension because it's easy to gauge, while ignoring the functional KPC, wastes effort and hides the real risk.
- Skipping gage R&R or FAI. Charting without a validated measurement system or an approved baseline produces limits nobody can trust, a point SafetyChain's capability guidance makes directly when it comes to launching charts before FAI sign-off.
Pro Tip: If an operator can't explain in one sentence why a particular feature is being charted, that's a sign the KPC selection needs a second look.
How Flying Chip Factory applies SPC to tight-tolerance parts
On parts like the E2 Kickstand's pivot bore, Flying Chip Factory ties key process characteristics directly to functional fit, not just print tolerance. Tool-wear signals get logged alongside dimensional data, so an insert nearing end-of-life triggers a proactive swap instead of a reactive scrap pile.
Our SOPs cover gage calibration cadence, part ID traceability on every logged measurement, and chart annotations for every tooling change or program edit. That annotation habit, combined with SOP discipline, mirrors the exact factor an MIT study on high-volume machining SPC identified as the difference between consistent quality and scattered results: portable, well-documented procedures that new operators can follow reliably. The result on short runs is fewer scrapped setups and a clearer trail back to root cause when something does drift.
Reading the chart: control rules that actually catch problems
A control chart is useless if nobody knows what an out-of-control signal looks like beyond "a point crossed the line." The classic Western Electric or Shewhart rules give operators concrete triggers instead of vague judgment calls.
The core rules most shops apply: any single point beyond the 3-sigma control limit signals an immediate stop. Seven or eight consecutive points on the same side of the centerline signal a shift in the process mean, even if no individual point breaks a limit. Two out of three consecutive points beyond 2-sigma on the same side indicate an emerging problem worth investigating before it becomes a full violation. A steady run of six or more points trending in one direction, up or down, flags a drift pattern, exactly the signature of a wearing insert or a fixture loosening over time.
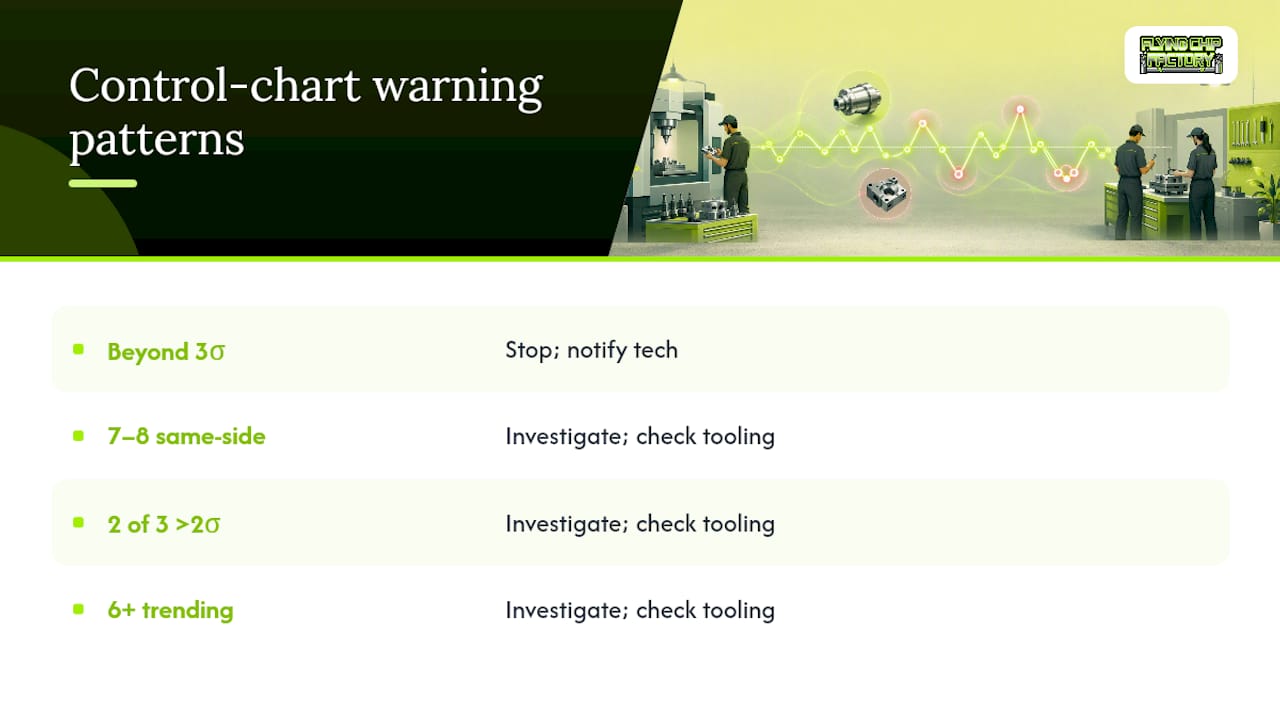
None of these rules require a statistician on the floor. They require an operator trained to recognize the pattern and a clear, written response: stop, check tooling, notify the technician, document the finding. Where these rules earn their keep in machining specifically is catching gradual degradation. A single-point limit violation catches a sudden problem, a broken insert or a fixture that slipped. The run-based and trend-based rules catch the slow stuff, which in a machining cell is usually tool wear, thermal drift, or a slowly loosening clamp. Ignoring the trend rules and only watching for limit violations means you're only catching half your problems, and often the more expensive half, since a slow drift can run for hours before a single part actually crosses a limit.
Where AIAG‑VDA and ISO standards fit into shop SPC
Standards give SPC programs a shared vocabulary and a defensible baseline, which matters most when a machining shop is supplying automotive or safety-critical customers who audit quality systems directly. The AIAG‑VDA SPC Yellow Volume is the reference document most automotive-adjacent shops work from, and its central message is worth repeating: SPC exists to reduce variation and build process knowledge, not to serve as a fancier way of checking parts against a print.
One distinction the standard draws sharply is between control limits and specification limits. Control limits come from the process itself, calculated from actual variation in stable production. Specification limits come from the engineering drawing and reflect what the customer needs, not what the machine is currently doing. A process can be perfectly "in control" statistically while still producing parts outside the print tolerance, which is exactly why capability studies exist as a separate step from control charting.
ISO 9001 and IATF 16949 both reference statistical techniques as part of a broader quality management system, without prescribing the exact chart types a shop must use. That flexibility is intentional. A prototype shop running one-piece flow needs a different sampling approach than a tier-one automotive supplier running 50,000 identical brackets, and the standards leave room for that. What they do require, consistently, is documentation: a defined method, a rationale for chart selection, and records that show the process was actually monitored, not just charted for show during an audit window. For a shop building short-run or prototype parts, leaning on that same documentation discipline, even informally, tends to catch problems auditors would otherwise find first.
Connecting SPC data to CNC controls and Industry 4.0 systems
Modern CNC machine controls generate far more data than a spindle speed and a feed rate. In-process probing cycles, spindle load monitoring, and adaptive control feedback all produce measurements that used to require a separate metrology step. Feeding that data directly into an SPC system, rather than transcribing it by hand, closes the gap between when a problem starts and when someone notices it.
A manufacturing execution system (MES) sitting between the machine control and the quality database is what makes this practical at scale. Instead of an operator writing a bore diameter on a tally sheet every tenth part, an in-machine probe measures every part and logs it automatically, timestamped and tied to a specific tool offset and program revision. That level of traceability turns a control chart from a periodic snapshot into a near-continuous record.
The Industry 4.0 framing that gets thrown around a lot in manufacturing circles boils down to something fairly concrete for a machining cell: sensors on the spindle and axes, a network connection back to a central system, and software that turns raw signals into a chart an engineer can actually read. Real-time dashboards showing X̄-R charts updating as parts come off the machine let an engineer catch a drift from a desk instead of waiting for an end-of-shift report. None of this replaces the fundamentals covered earlier, subgroup validity, KPC selection, gage R&R still matter exactly as much. What automation changes is speed and volume of data, not the underlying statistics.
Multivariate SPC and real-time monitoring for complex parts
Traditional SPC charts one characteristic at a time, which works fine until a part has a dozen interrelated dimensions where the real risk is a combination of factors shifting together rather than any single measurement drifting alone. Multivariate SPC techniques, such as Hotelling's T² statistic, track several correlated variables simultaneously and can flag an out-of-control condition that wouldn't trip any single univariate chart.
A practical machining example: bore diameter and bore roundness might each stay within their individual control limits while their relationship shifts in a way that signals a spindle bearing problem. A multivariate approach catches that interaction. The tradeoff is complexity. Multivariate charts require more sophisticated software and a clearer statistical background to interpret correctly, which is why most shops start with univariate charts on their tightest-tolerance features and only add multivariate monitoring once they've got the basics running reliably.
Real-time monitoring, whether univariate or multivariate, shifts SPC from a periodic review activity to something closer to a live dashboard. Instead of an engineer pulling data at the end of a shift, a monitor on the machine flags an emerging trend within minutes, sometimes triggering an automatic hold on the next cycle until someone reviews it. For high-mix, low-volume shops running prototypes and short production runs, the more valuable investment is usually solid univariate charting done consistently, since the volume rarely justifies the overhead of a full multivariate system.
SPC as an early warning system for tool wear and maintenance
Tool wear is one of the most predictable sources of variation in machining, and that predictability is exactly what makes SPC such a strong maintenance signal. Instead of waiting for a part to fail inspection, a control chart showing a slow, steady drift in a bore diameter or a surface finish measurement tells you an insert is degrading well before it produces a scrap part.
This connects SPC directly to predictive maintenance. Rather than replacing tooling on a fixed schedule, tied to a part count regardless of actual condition, a shop watching the trend line can replace an insert when the data shows it's approaching its wear limit, not before and not after. That avoids two costly outcomes: swapping tooling too early and wasting usable tool life, or running it too long and producing a batch of parts that drift out of spec. Practical SPC guidance on this point notes that plotting data in real time lets operators act proactively, swapping an insert or checking a fixture before a defect actually occurs, rather than reacting after the fact.
Spindle load and vibration data extend the same logic beyond the cutting tool itself. A spindle bearing beginning to fail often shows up as increased variability in a dimensional chart before it shows up as an audible problem or a machine alarm. Treating that variability as a maintenance signal, not just a quality signal, turns SPC into a tool that protects the machine as much as it protects the part.
What SPC implementation looks like across different shop environments
A high-volume automotive supplier and a prototype shop face completely different SPC challenges, even though the underlying statistics are identical. The high-volume environment usually has the metrology equipment and the data volume to support sophisticated charting from day one. The bottleneck is almost always discipline: getting operators to follow the sampling plan consistently, shift after shift, without shortcuts creeping in over time. The MIT study on SPC in a high-volume machining center found exactly this pattern: scrap reduction came from SOP discipline and operator training, not from acquiring better gauges. The equipment was often already capable; the procedures around using it consistently were not.
A prototype or short-run shop faces the opposite problem. Volume is too low for traditional subgrouped charts, so I-MR charts on individual parts become the practical choice, and the challenge shifts to deciding which of a handful of parts actually justifies the charting effort in the first place. Documented industry examples report reductions in out-of-spec parts as high as 62% after introducing SPC in precision machining contexts, though results vary widely depending on how unstable the starting process was and how rigorously the sampling plan gets followed.
The common thread across both environments isn't the chart type or the sample size. It's whether the shop treats SPC as a genuine process-improvement tool tied to real KPCs, or as a paperwork exercise generated to satisfy an audit checklist.
When manual charts stop being enough
Paper charts and a clipboard work fine for a low-volume job with a handful of KPCs. The math doesn't change once you're running higher volumes or tighter tolerances, but the workload does, and that's usually the real trigger for automating: not the statistics getting harder, but a human falling behind on plotting points in real time.
The criteria worth weighing are volume, how much the process actually varies, and what a failure costs you. A prototype run with generous tolerances rarely justifies automated SPC software. A short run of parts feeding a critical assembly, where a scrapped batch costs real money and time, usually does. SPC isn't a standalone initiative either; it feeds directly into Lean and Six Sigma work, since you can't improve a process you can't first measure and stabilize.
My honest recommendation: pick one feature, run it manually, and prove it catches real problems before investing in automation across the whole cell. If you can't show a manual pilot cutting scrap or catching drift early, an automated system won't fix that; it'll just generate the same bad decisions faster.
— Drake
Get machinist-led SPC support for your next prototype or short run
Getting SPC right on a new part starts with a shop that treats measurement as part of the job, not an afterthought. Inspection and charting can be integrated into prototype and short-run work from the first article forward, ideally with direct access to the machinist running the job rather than going through an account manager.

That direct line matters most when a KPC needs a second look mid-run, since a quick conversation with the person actually holding the part beats a support ticket every time. Standard operating procedures (SOPs) may be written for specific tolerances, rather than adapted from generic templates, and gage calibration and chart annotation can be part of regular practice rather than occasional tasks. If you're planning a prototype run or a short production job and want an inspection plan built around your actual critical dimensions, request a quote from Flying Chip Factory and talk through the KPCs with the machinist who'll be cutting the part.
Sources
- Statistical process control (SPC) in a high volume machining center : value of standard operating procedures
- NIST process capability guidance (Cp / Cpk)
- ASQ: Statistical process control
FAQ
What is SPC in manufacturing?
Statistical process control is a method that uses control charts and real-time data to monitor a process while it's running, catching drift before it produces out-of-spec parts, rather than sorting good parts from bad after the fact.
Is SPC a Six Sigma tool?
SPC predates Six Sigma and functions as a standalone statistical discipline, though it's a core component of most Six Sigma programs; treating it as exclusive to Six Sigma undersells how broadly applicable it is on its own.
What are the 7 rules of SPC?
Common detection rules include a single point beyond the 3-sigma limit, seven or more consecutive points on one side of the centerline, two of three consecutive points beyond 2-sigma, and a sustained run trending in one direction. Exact rule sets vary slightly by source, but all flag either a sudden shift or a gradual drift.
What is the difference between SPC and Cpk?
SPC monitors whether a process is stable over time using control charts; Cpk is a capability index calculated after the process is already in statistical control, measuring how well that stable process fits within the print tolerance.
How does Flying Chip Factory use SPC on short production runs?
Flying Chip Factory ties key process characteristics to functional requirements on parts like the E2 Kickstand, logging tool-wear signals alongside dimensional data and annotating charts with tooling changes to keep root-cause analysis fast on prototype and short-run jobs.